AI
Monitoring Resource Utilization in Google Colab

Google Colab is a widely-used platform that allows developers to write and execute Python in the browser, offering an excellent environment for Machine Learning and Data Science. It is crucial to monitor these resources to optimize your code and prevent resource exhaustion. This article will outline how to keep track of GPU, CPU, memory, disk, and network utilization in Google Colab.
If you're curious about what compute resources are available, the costs, and performance associated with them, check out this article we wrote summarizing all the possible compute options.
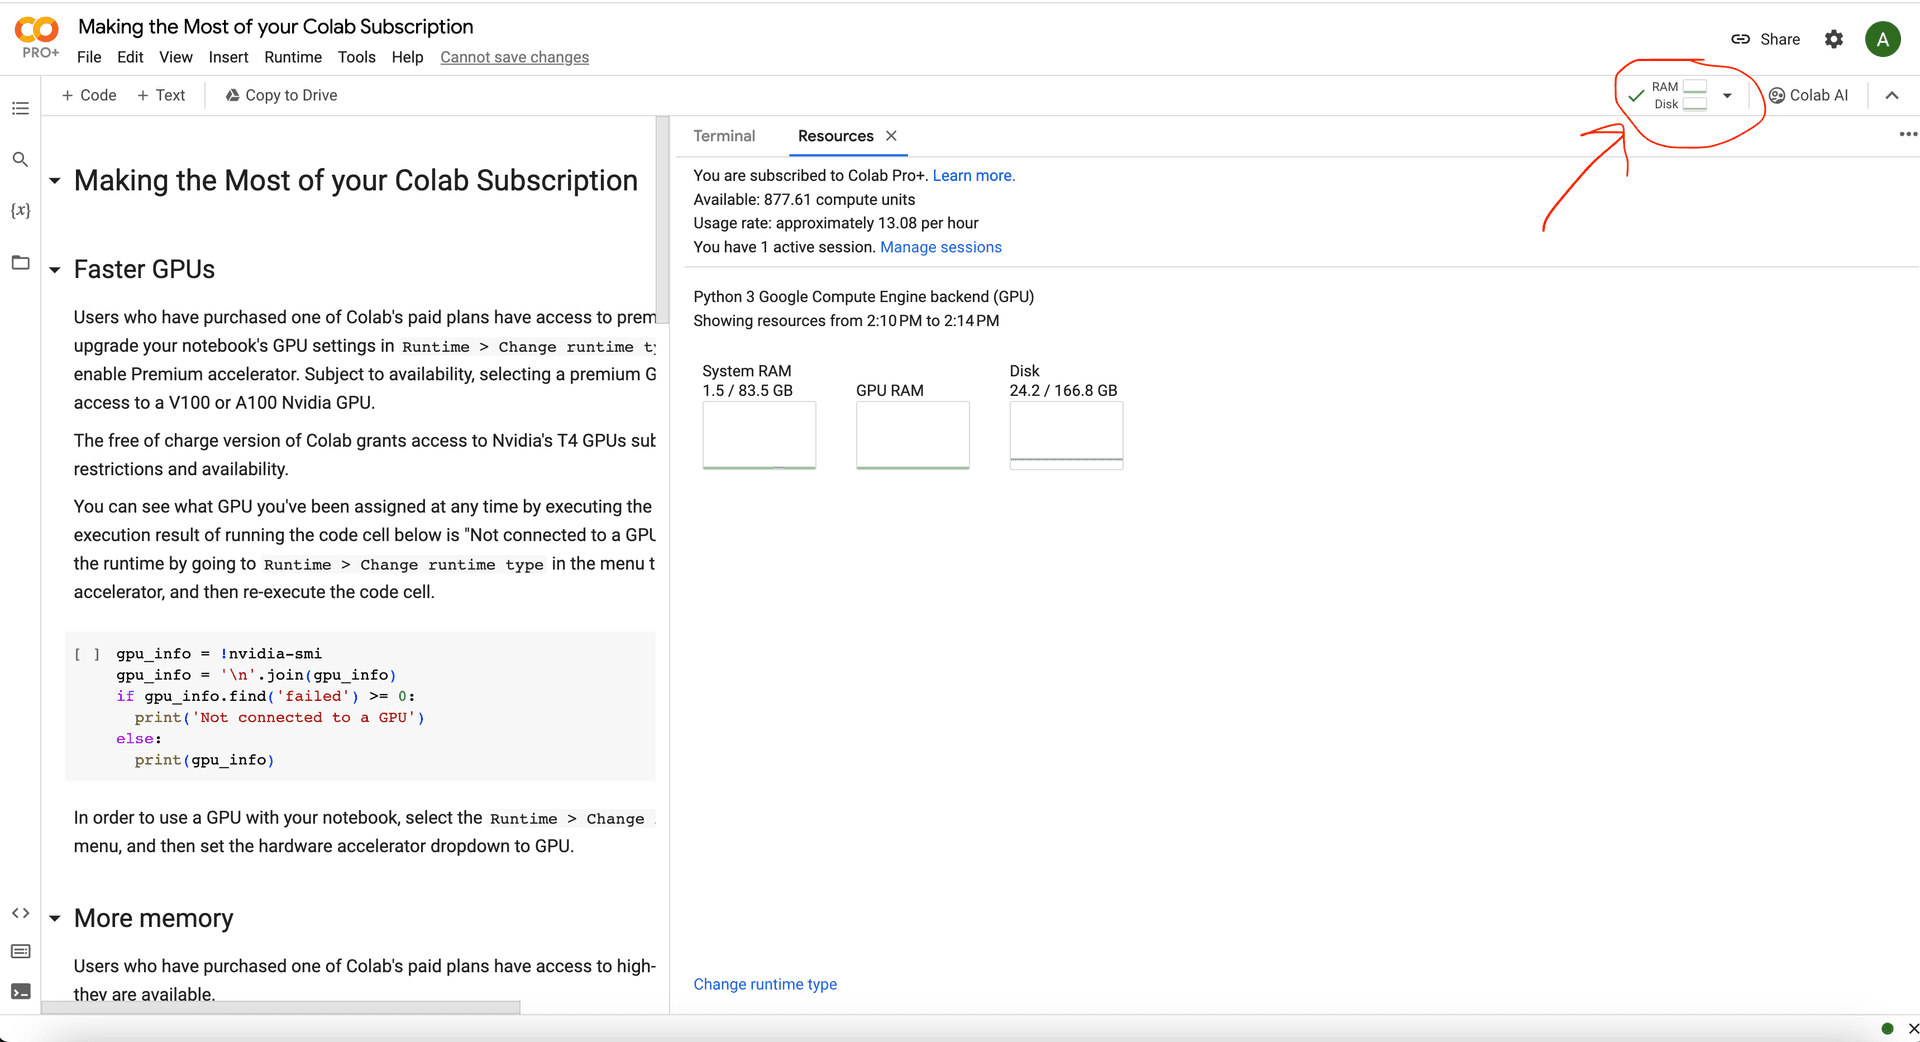
System RAM, GPU RAM, Disk
Google Colab provides a dashboard that displays information about the resources used during a session. Click on the button to expand it in the top right hand side of Colab.
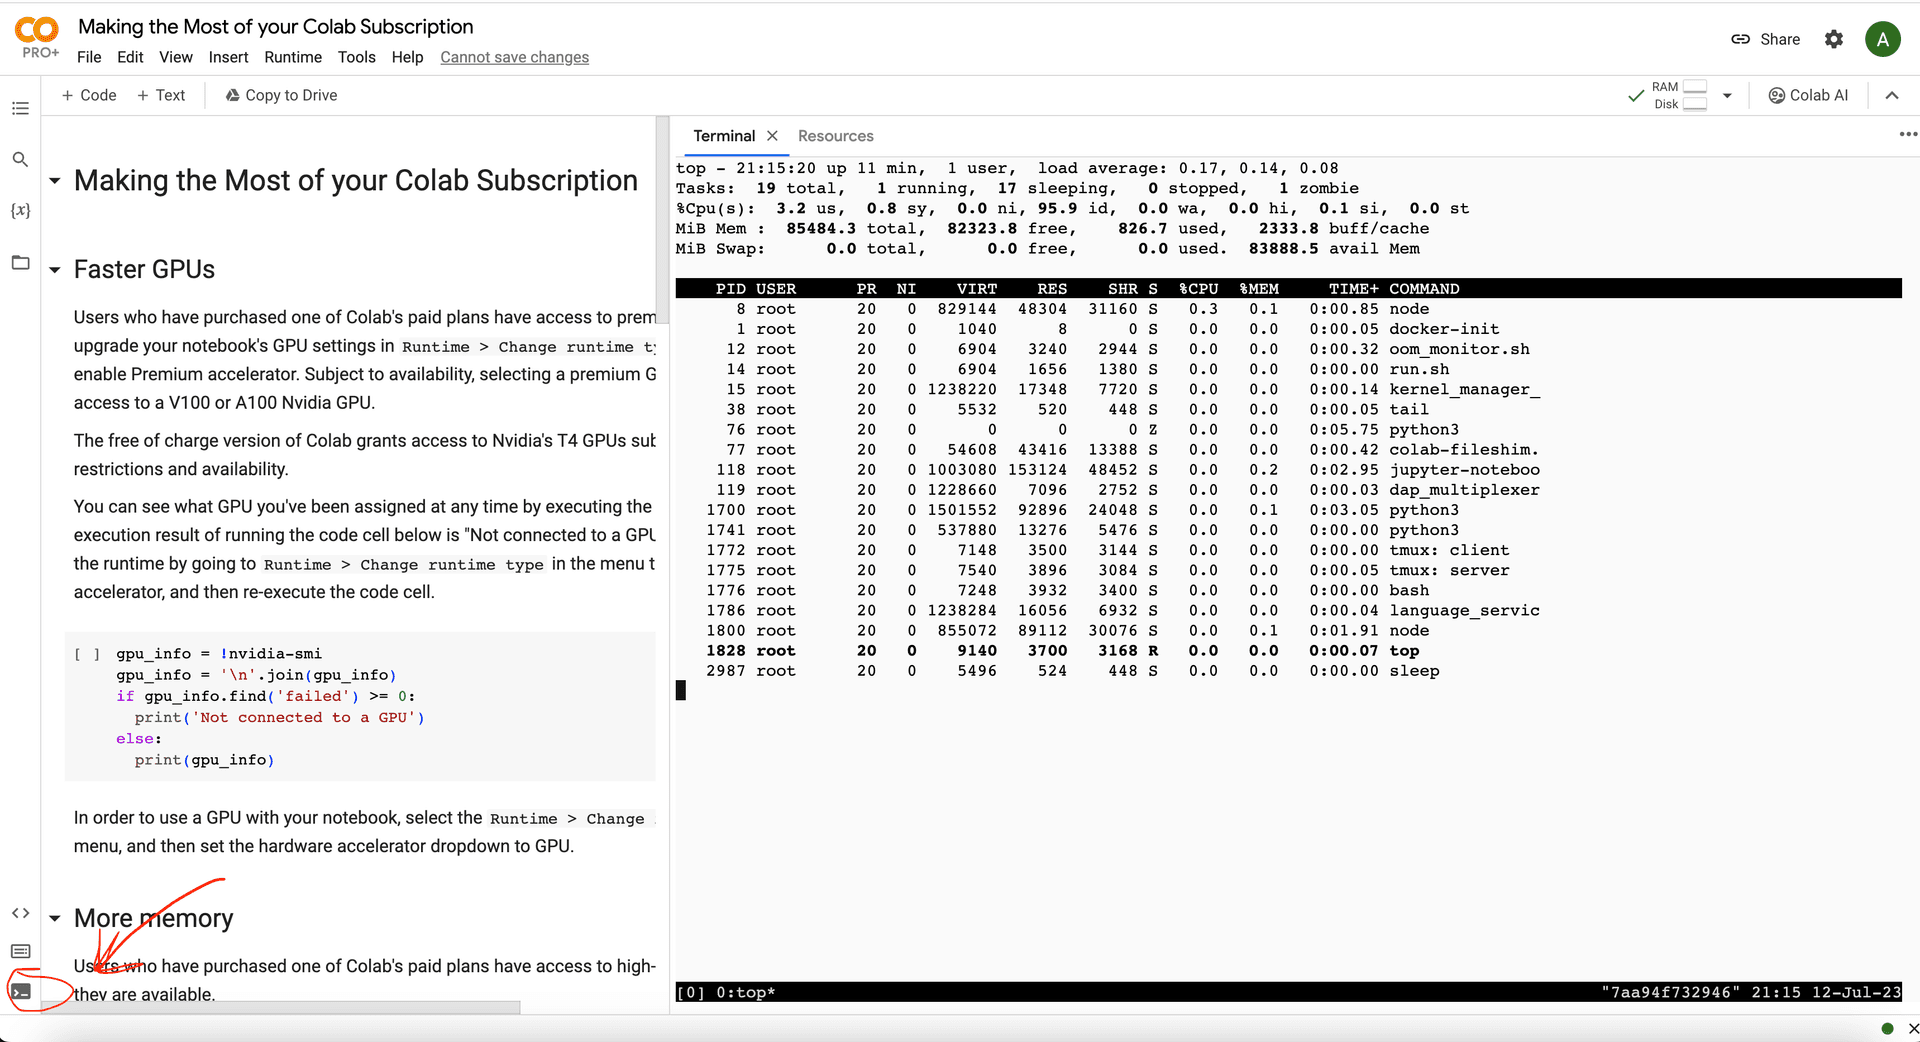
CPU Usage
To Take a look at processes, and CPU usage use the top command in the terminal.
top
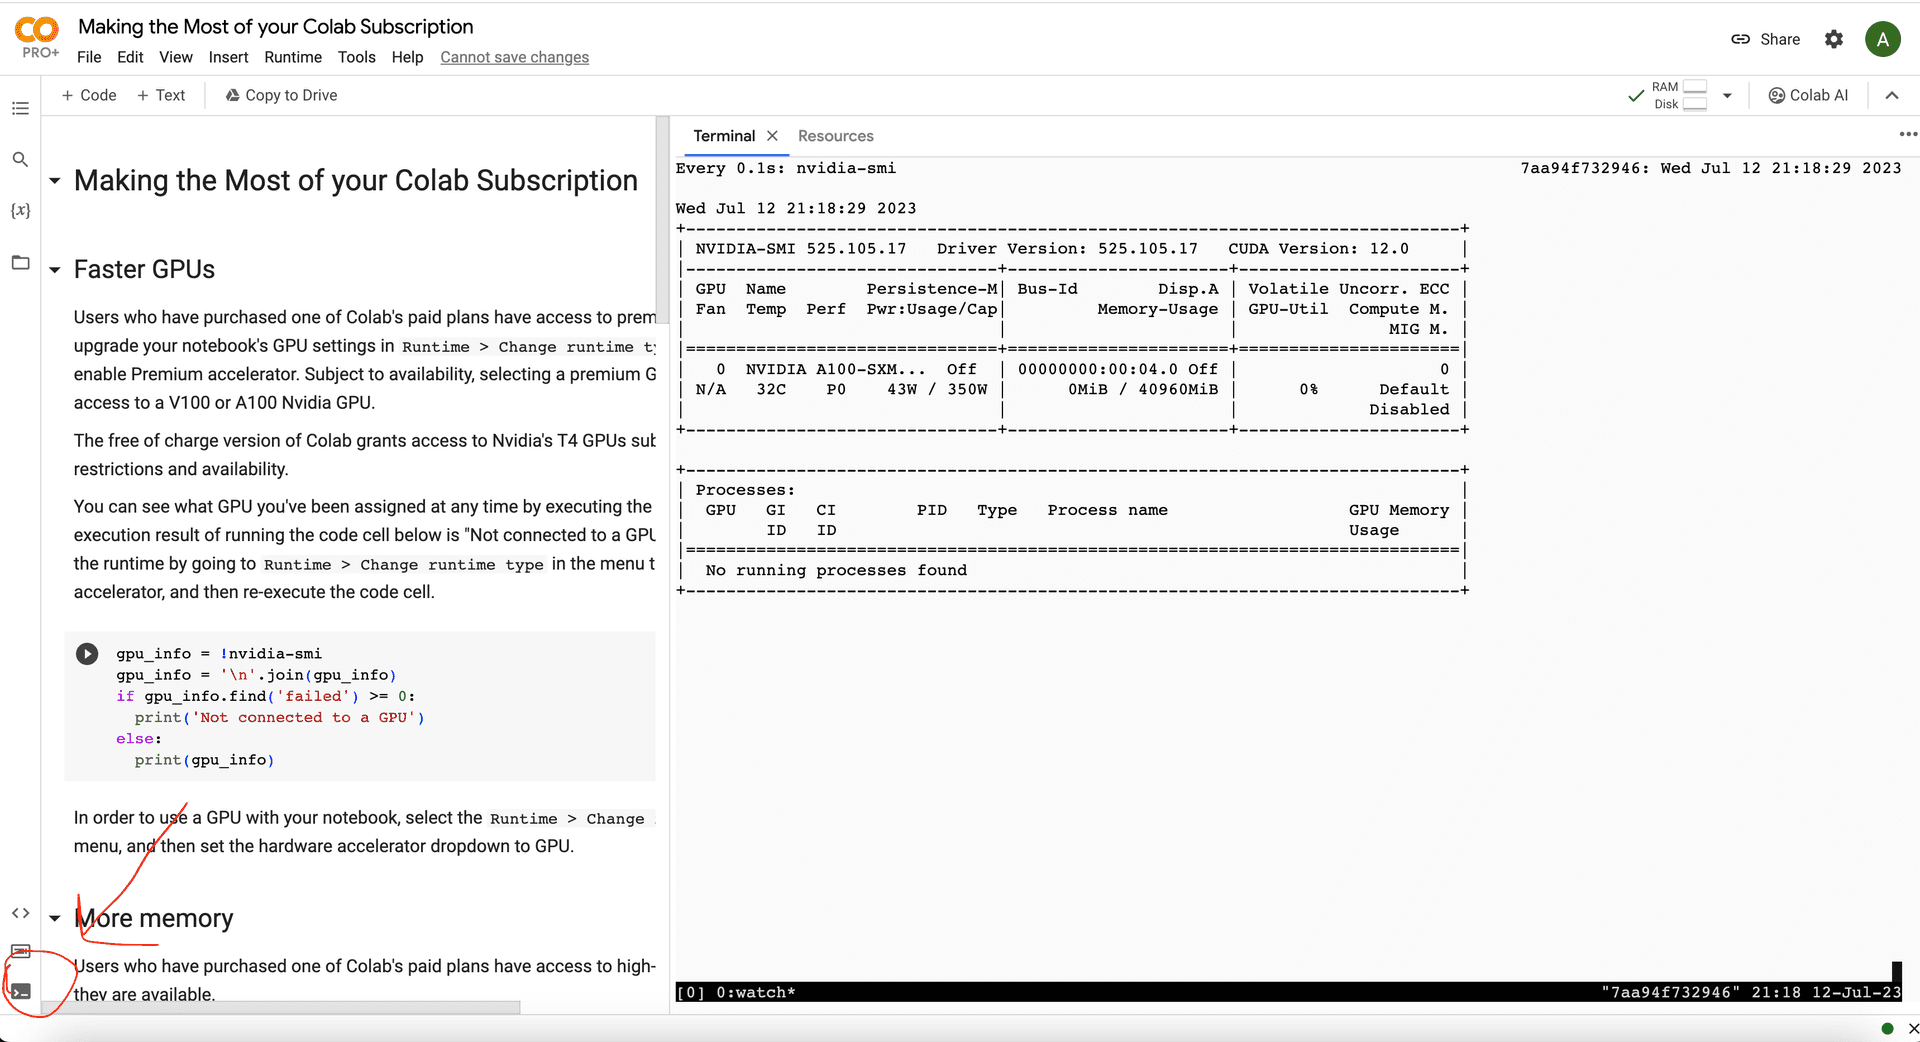
GPU Usage
Use the terminal to run nvidia-smi a tool provided by Nvidia to monitor GPUs.
watch -n0.1 nvidia-smi
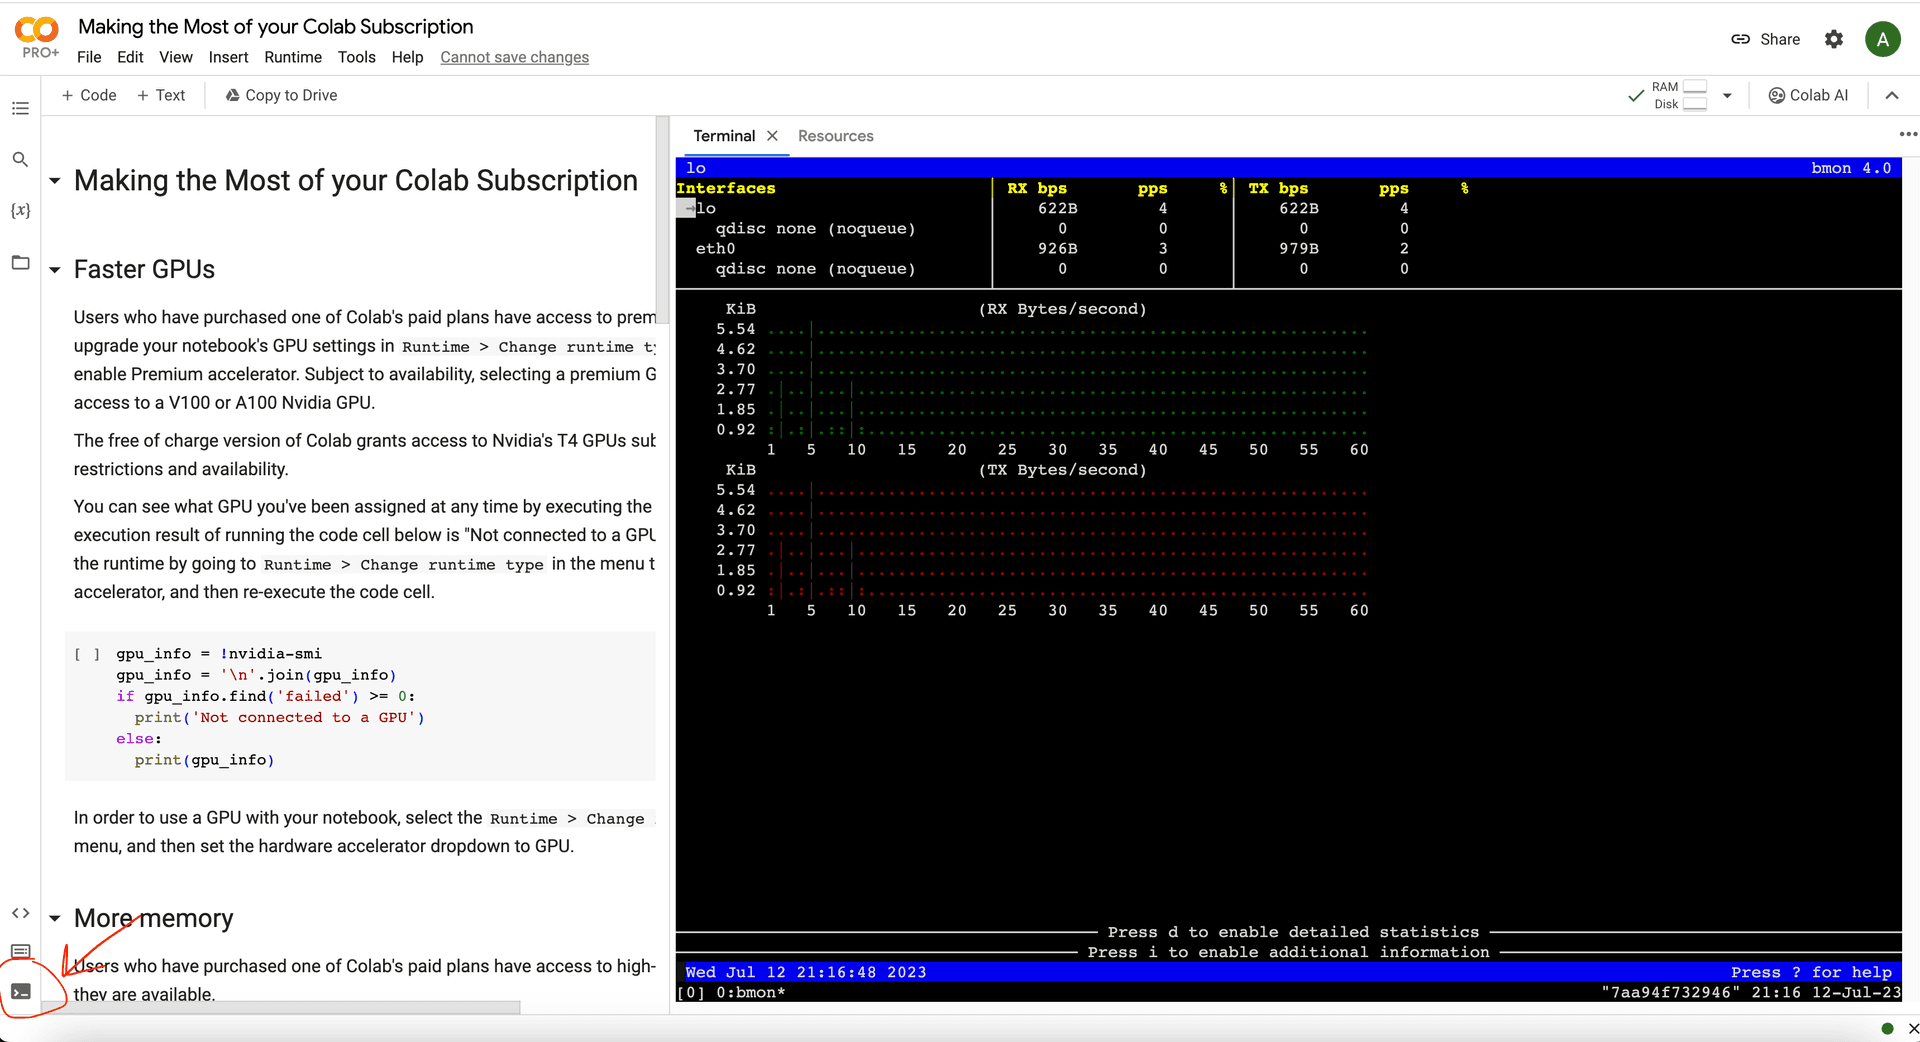
Network:
Use the terminal to run bmon a bandwidth monitor and rate estimator.
apt-get install bmon && bmon
Conclusion
Monitoring resource utilization is an integral part of any computational task performed in Google Colab. Ensuring that your resources are being utilized efficiently can help improve the speed and performance of your code, and prevent resource exhaustion.